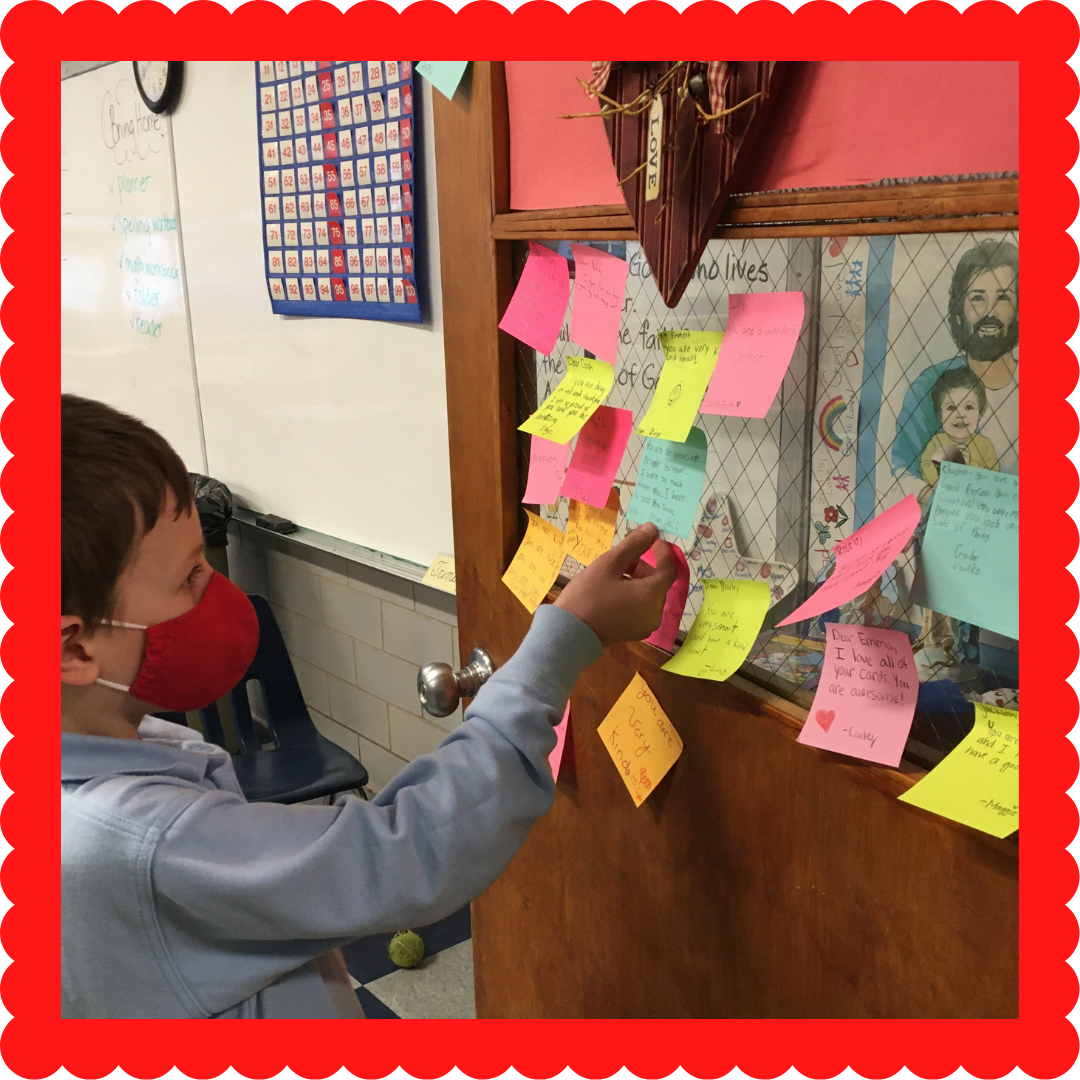
This is a fun activity. When I break out the gallon baggie full of candy, students get VERY excited! I like to use it during those few days before Christmas break or at the end of the school year. (It’s designed for Google Classroom; but is adaptable for Microsoft Excel). The activity focuses on creating a comparison spreadsheet and a line chart using Google Sheets. Students will learn how to format numbers and data, rename a sheet, and create and customize a line chart.

Students will need to: (1) determine and record the estimate color distribution of skittles in their snack package, (2) record the actual color distribution, and (3) create a line chart depicting the estimate and actual counts. Students can work independently, in small groups, or may follow along with the teacher as she creates her own spreadsheet.

Materials: 1 Skittles© candy snack package per student, 1 baggie to store candy (before eating), device, internet connection
This illustrated, step-by-step guided lesson is available on Teacher Pay Teachers. I’d love to hear how your students fared.


